Seeing the news about flight accidents and aeroplane crashes makes you question airline safety? Does it make you afraid to fly? Regardless of the major flight incidents that happened, according to a study by the Massachusetts Institute of Technology(MIT), flying on commercial airlines actually has never been safer (Dizikes 2020). The study has found that passenger fatalities have been decreasing, even in the long term.
In this article, we will dive into past airlines’ performance, analyse the data and answer the question: “Have airline safety really improved these past decades?”
About the data
The data for this article is sourced from TidyTuesday, which has been modified from the original data by Aviation Safety Network.
The data contains 336 observations and 6 variables. These variables are:
| Variable | Class | Description |
|---|---|---|
| X | integer | Number of observations |
| airline | character | Airline (asterisk indicates that regional subsidiaries are included) |
| avail_seat_km_per_week | double | Available seat kilometers flown every week |
| year_range | character | Range of year (1985-1999 & 2000-2014) |
| type_of_event | character | Types of events happened : incidents, fatal accidents, fatalities |
| n_events | integer | Total number of event that happened |
Analysis
Let’s first look at the overall trend between the range of 1985-1999 and 2000-2014 for each type of event.
| Type of event | 1985-1999 | 2000-2014 | Difference(%) |
|---|---|---|---|
| incidents | 7.179 | 4.125 | -42.537 |
| fatal accidents | 2.179 | 0.661 | -69.672 |
| fatalities | 112.411 | 55.518 | -50.612 |
From the Table 1 above, we can see that airlines did become safer as the number of incidents, fatal accidents, and fatalities decreased. On average the number of occurrences in the period 2000-14 declined roughly half compared to 1985-1999. This finding is also supported by (Barnett 2020) study, which claims that the accident risk indeed reduced by a factor of two every decade.
“The worldwide risk of being killed had been dropping by a factor of two every decade.” - (Barnett 2020).
Now that we have the overall image of the trend, we will take a closer look at each type of the events.
Incidents
To compare the number of incidents during both periods, I will take the top 10 airlines with the highest number of incidents that occurred in 1985-1999 and 2000-2014.
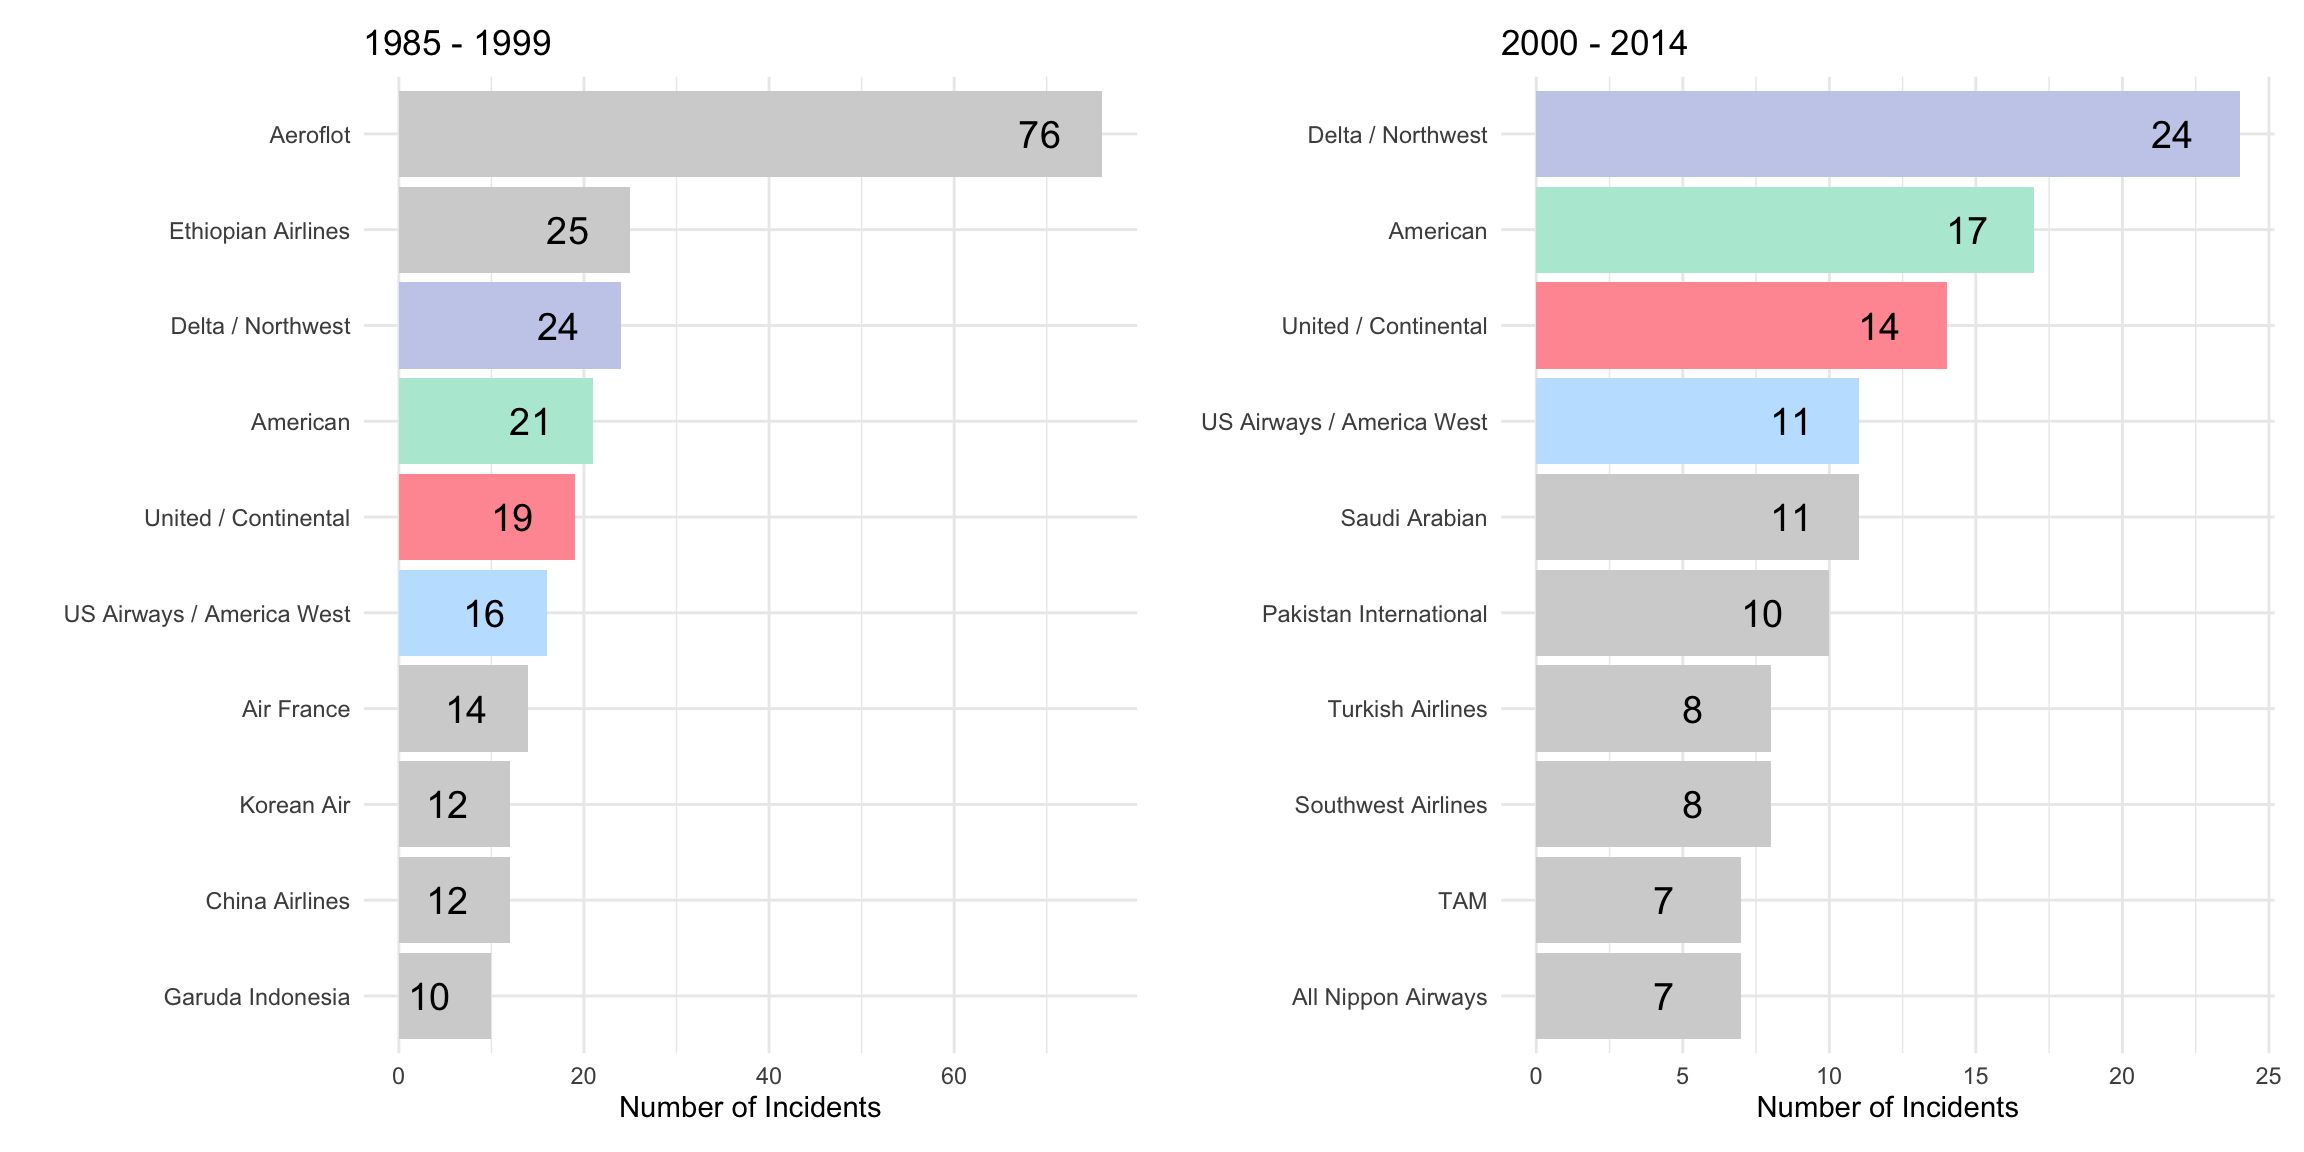
The Figure 1 shows the airlines with the most incidents in both ranges of years. Despite 4 airlines from the US staying in the top 10 and Delta Airlines having the same number of incidents in both periods, the incidents decreased with the highest of 24 incidents in 2000-2014, dropping almost 70% from 1985-1999.
Fatal Accidents
Within those incidents, a few numbers are fatal, causing fatalities. Similarly, we will compare the ten airlines with the highest number of fatal accidents in 1985-1999 and 2000-2014.
We can see from Figure 2 a significant difference, especially in the top 5 ranks. On average, in 1985-1999, 3.5 times more fatal accidents occurred than in 2000-2014. We can contrast the difference by looking at the first rank, Aeroflot, with 14 fatal accidents in 1985-1999, compared to American Airlines, with just three fatal accidents in 2000-2014. This indicates a significant improvement in airline safety, preventing fatal accidents over the years.
Fatalities
Fatal accidents cause fatalities, risking the crews’ and the passengers’ lives. So along with the declining incident and fatal accident numbers, we will analyse whether the fatality rate also decreased.
| 1985-1999 | 2000-2014 | Difference (%) |
|---|---|---|
| 1.297 | 0.648 | -50.058 |
The rate of fatalities is calculated following the method used by Silver (2014). Dividing the number of fatalities by the number of available seat kilometers(ASK) flown every week, with the assumption that the airlines have the same ASK over the years.
Table 2 indicates that, on average, the rate of fatalities has dropped by half with potential risk of 0.6 in 10 million by 2000-2014. It means that only 1 people over 17 million seats offered by the airlines potentially have the risk to be in a fatal accident.
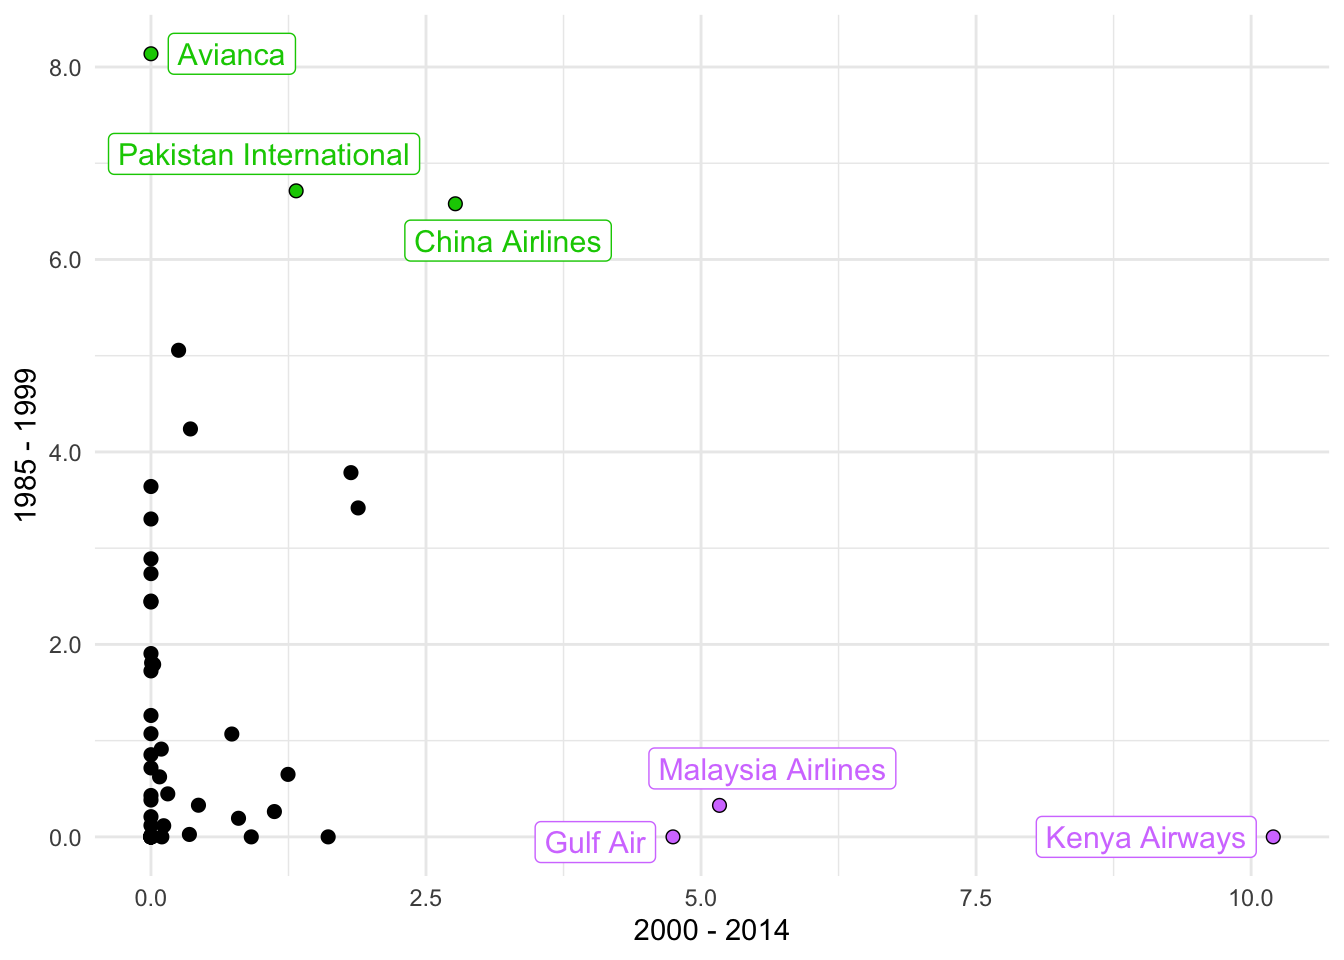
Moreover, most airlines with a high rate of fatalities in 1985-1999, such as Avianca, Pakistan International and China Airlines, were unlikely to have a high rate of fatalities in the next decades as shown in Figure 3. On the other side, even though airlines that had a low fatality rate in 1985-1999 did not perform well and resulted in a higher rate of fatalities in 2000-2014, like Kenya Airways, Malaysia Airlines and Gulf Air, the fatality rate of the other airlines was shown to be lower.
So, has airline safety really improved these past decades?
Based on our analysis of the number of incidents, fatal accidents and rate of fatalities, comparing data from two period of year, 1985-1999 and 2000-2014, we can say that airline safety had improved. Most of the airlines also showed improvement of their safety performance resulting in a huge drop of incidents and fatalities. Moreover, in the latest report from International Air Transport Association (n.d.) also finds that “long-term accident trends confirm that aviation is getting safer”.
Therefore, do not worry to fly as AIRLINE SAFETY REALLY HAS IMPROVED and is getting safer.
The following are the OS system and R-packages used for this article:
─ Session info ───────────────────────────────────────────────────────────────
 setting  value
 version  R version 4.1.2 (2021-11-01)
 os       macOS Monterey 12.4
 system   aarch64, darwin20
 ui       X11
 language (EN)
 collate  en_US.UTF-8
 ctype    en_US.UTF-8
 tz       Australia/Melbourne
 date     2022-09-06
 pandoc   2.18 @ /Applications/RStudio.app/Contents/MacOS/quarto/bin/tools/ (via rmarkdown)

─ Packages ───────────────────────────────────────────────────────────────────
 package       * version date (UTC) lib source
 assertthat      0.2.1   2019-03-21 [2] CRAN (R 4.1.0)
 backports       1.4.1   2021-12-13 [2] CRAN (R 4.1.1)
 broom           1.0.0   2022-07-01 [1] CRAN (R 4.1.1)
 cellranger      1.1.0   2016-07-27 [2] CRAN (R 4.1.0)
 cli             3.3.0   2022-04-25 [2] CRAN (R 4.1.1)
 colorspace      2.0-3   2022-02-21 [2] CRAN (R 4.1.1)
 crayon          1.5.1   2022-03-26 [2] CRAN (R 4.1.1)
 crosstalk       1.2.0   2021-11-04 [1] CRAN (R 4.1.1)
 data.table      1.14.2  2021-09-27 [1] CRAN (R 4.1.1)
 DBI             1.1.3   2022-06-18 [1] CRAN (R 4.1.1)
 dbplyr          2.2.1   2022-06-27 [2] CRAN (R 4.1.1)
 digest          0.6.29  2021-12-01 [2] CRAN (R 4.1.1)
 dplyr         * 1.0.9   2022-04-28 [2] CRAN (R 4.1.1)
 ellipsis        0.3.2   2021-04-29 [2] CRAN (R 4.1.0)
 evaluate        0.15    2022-02-18 [2] CRAN (R 4.1.1)
 fansi           1.0.3   2022-03-24 [2] CRAN (R 4.1.1)
 farver          2.1.1   2022-07-06 [2] CRAN (R 4.1.1)
 fastmap         1.1.0   2021-01-25 [2] CRAN (R 4.1.0)
 forcats       * 0.5.1   2021-01-27 [1] CRAN (R 4.1.1)
 fs              1.5.2   2021-12-08 [2] CRAN (R 4.1.1)
 gargle          1.2.0   2021-07-02 [2] CRAN (R 4.1.0)
 generics        0.1.3   2022-07-05 [2] CRAN (R 4.1.1)
 ggplot2       * 3.3.6   2022-05-03 [2] CRAN (R 4.1.1)
 ggrepel       * 0.9.1   2021-01-15 [1] CRAN (R 4.1.1)
 glue            1.6.2   2022-02-24 [2] CRAN (R 4.1.2)
 googledrive     2.0.0   2021-07-08 [2] CRAN (R 4.1.0)
 googlesheets4   1.0.0   2021-07-21 [2] CRAN (R 4.1.0)
 gtable          0.3.0   2019-03-25 [2] CRAN (R 4.1.1)
 haven           2.5.0   2022-04-15 [2] CRAN (R 4.1.1)
 highr           0.9     2021-04-16 [2] CRAN (R 4.1.0)
 hms             1.1.1   2021-09-26 [2] CRAN (R 4.1.1)
 htmltools       0.5.3   2022-07-18 [2] CRAN (R 4.1.1)
 htmlwidgets     1.5.4   2021-09-08 [1] CRAN (R 4.1.1)
 httr            1.4.3   2022-05-04 [2] CRAN (R 4.1.1)
 jsonlite        1.8.0   2022-02-22 [2] CRAN (R 4.1.1)
 kableExtra    * 1.3.4   2021-02-20 [1] CRAN (R 4.1.1)
 knitr           1.39    2022-04-26 [1] CRAN (R 4.1.1)
 labeling        0.4.2   2020-10-20 [2] CRAN (R 4.1.0)
 lazyeval        0.2.2   2019-03-15 [1] CRAN (R 4.1.0)
 lifecycle       1.0.1   2021-09-24 [2] CRAN (R 4.1.1)
 lubridate       1.8.0   2021-10-07 [1] CRAN (R 4.1.1)
 magrittr        2.0.3   2022-03-30 [2] CRAN (R 4.1.1)
 modelr          0.1.8   2020-05-19 [2] CRAN (R 4.1.0)
 munsell         0.5.0   2018-06-12 [2] CRAN (R 4.1.0)
 patchwork     * 1.1.1   2020-12-17 [1] CRAN (R 4.1.1)
 pillar          1.8.0   2022-07-18 [2] CRAN (R 4.1.1)
 pkgconfig       2.0.3   2019-09-22 [2] CRAN (R 4.1.0)
 plotly        * 4.10.0  2021-10-09 [1] CRAN (R 4.1.1)
 purrr         * 0.3.4   2020-04-17 [2] CRAN (R 4.1.0)
 R6              2.5.1   2021-08-19 [2] CRAN (R 4.1.1)
 RColorBrewer    1.1-3   2022-04-03 [1] CRAN (R 4.1.1)
 Rcpp            1.0.9   2022-07-08 [2] CRAN (R 4.1.1)
 readr         * 2.1.2   2022-01-30 [2] CRAN (R 4.1.1)
 readxl          1.4.0   2022-03-28 [1] CRAN (R 4.1.1)
 reprex          2.0.1   2021-08-05 [2] CRAN (R 4.1.1)
 rlang           1.0.4   2022-07-12 [2] CRAN (R 4.1.1)
 rmarkdown       2.14    2022-04-25 [1] CRAN (R 4.1.2)
 rstudioapi      0.13    2020-11-12 [2] CRAN (R 4.1.0)
 rvest           1.0.2   2021-10-16 [2] CRAN (R 4.1.1)
 scales        * 1.2.0   2022-04-13 [1] CRAN (R 4.1.1)
 sessioninfo   * 1.2.2   2021-12-06 [1] CRAN (R 4.1.1)
 stringi         1.7.8   2022-07-11 [2] CRAN (R 4.1.1)
 stringr       * 1.4.1   2022-08-20 [1] CRAN (R 4.1.1)
 svglite         2.1.0   2022-02-03 [1] CRAN (R 4.1.1)
 systemfonts     1.0.4   2022-02-11 [1] CRAN (R 4.1.1)
 tibble        * 3.1.8   2022-07-22 [1] CRAN (R 4.1.1)
 tidyr         * 1.2.0   2022-02-01 [2] CRAN (R 4.1.1)
 tidyselect      1.1.2   2022-02-21 [2] CRAN (R 4.1.1)
 tidyverse     * 1.3.2   2022-07-18 [1] CRAN (R 4.1.1)
 tzdb            0.3.0   2022-03-28 [2] CRAN (R 4.1.1)
 utf8            1.2.2   2021-07-24 [2] CRAN (R 4.1.0)
 vctrs           0.4.1   2022-04-13 [2] CRAN (R 4.1.1)
 viridisLite     0.4.0   2021-04-13 [2] CRAN (R 4.1.0)
 webshot         0.5.3   2022-04-14 [1] CRAN (R 4.1.1)
 withr           2.5.0   2022-03-03 [2] CRAN (R 4.1.1)
 xfun            0.31    2022-05-10 [1] CRAN (R 4.1.1)
 xml2            1.3.3   2021-11-30 [2] CRAN (R 4.1.1)
 yaml            2.3.5   2022-02-21 [2] CRAN (R 4.1.1)

 [1] /Users/josephinevalensia/Library/R/arm64/4.1/library
 [2] /Library/Frameworks/R.framework/Versions/4.1-arm64/Resources/library

──────────────────────────────────────────────────────────────────────────────